A Month in the Life of a Data Scientist
"What does a data scientist actually *do*?"
"What kinds of projects do you usually work on?"
"What does a typical day look like?"
These are questions I get asked a lot both by aspiring data scientists and the folks who want to hire them. My answer, in true data scientist fashion, is usually something along the lines of "it depends" -- and it's true! Most of my work involves juggling multiple projects that might have different stakeholders or touch different parts of the company, and the lifecycles of these projects can vary greatly depending on the complexity involved. In the eight years I've been doing applied analytics, no two weeks have looked the same. Furthermore, data science is such a growing and varied field that it's rare two data scientists would give the same answer (even at the same company!).
To help others get a feel for the types of projects a data scientist might do, and a bit of the day-to-day work, I used the 1 Second Everyday app to take a series of one second videos of what my work as a data scientist at an IoT startup looked like during the month of August. Check it out:
For context, my startup installed hardware into retail stores in order to track cardboard displays (the ones you see in CVS, for example, that are stocked with sunscreen or allergy medication) that go in and out of each store. We used sales data from those stores to calculate the incremental sales gained as a result of having these displays up, in addition to tracking other things like the supply chain process, and reported all of this back to the stores and brands whose products were on the displays. Lots of fun data to play with!
August consisted of three main projects for me (with lots of smaller projects thrown in):
Testing of IoT device updates: as an IoT company, we periodically rolled out firmware updates to our hardware, and August was a big update month. We used data to decide which units to update, how to space out the updates, and to monitor updates as they were being rolled out. After the updates, we performed more analysis to see whether the updates were making our RSSI signals stronger than they were before.
Improving our data pipeline: as a startup, we were constantly working to improve our data pipeline -- this meant incorporating new data, QA-ing our data inputs and pipeline outputs, chasing down bugs, updating to account for new logical cases and products, and building better documentation to describe what various pieces of the data pipeline were doing. As you can see, I used lots of data visualizations along the way to help us diagnose and improve the pipeline.
Professional development: I was fortunate enough to attend the JupyterCon tutorials and conference in August in NYC (check out my recap here). For me, conferences serve as a place to learn, meet great people, and get inspired by all of the cool things that folks are doing. Also, it's a lot of fun to do a local R-Ladies dinner, and I had a great time hanging out with NYC R-Ladies.
It's worth noting again that I had I taken these videos in July, or August, the set of projects I was working on would have been very different. (For example, one month was focused heavily on a classifier algorithm, and the other on creating and evaluating new metrics and ways of matching test and control stores.)
It's hard to distill the variance of a data scientist's job into a single video (or set of videos), but I hope this helps to give some insight into the types of projects a data scientist might be tasked with. One of the coolest things about being a data scientist right now is how much can vary day-to-day and week-to-week (even at the same job!) -- there's always more to learn and something new to try.
**
PS: Here's a full description of each snippet, in case you're curious:
Reviewing a design for a test of our hardware to be run in stores.
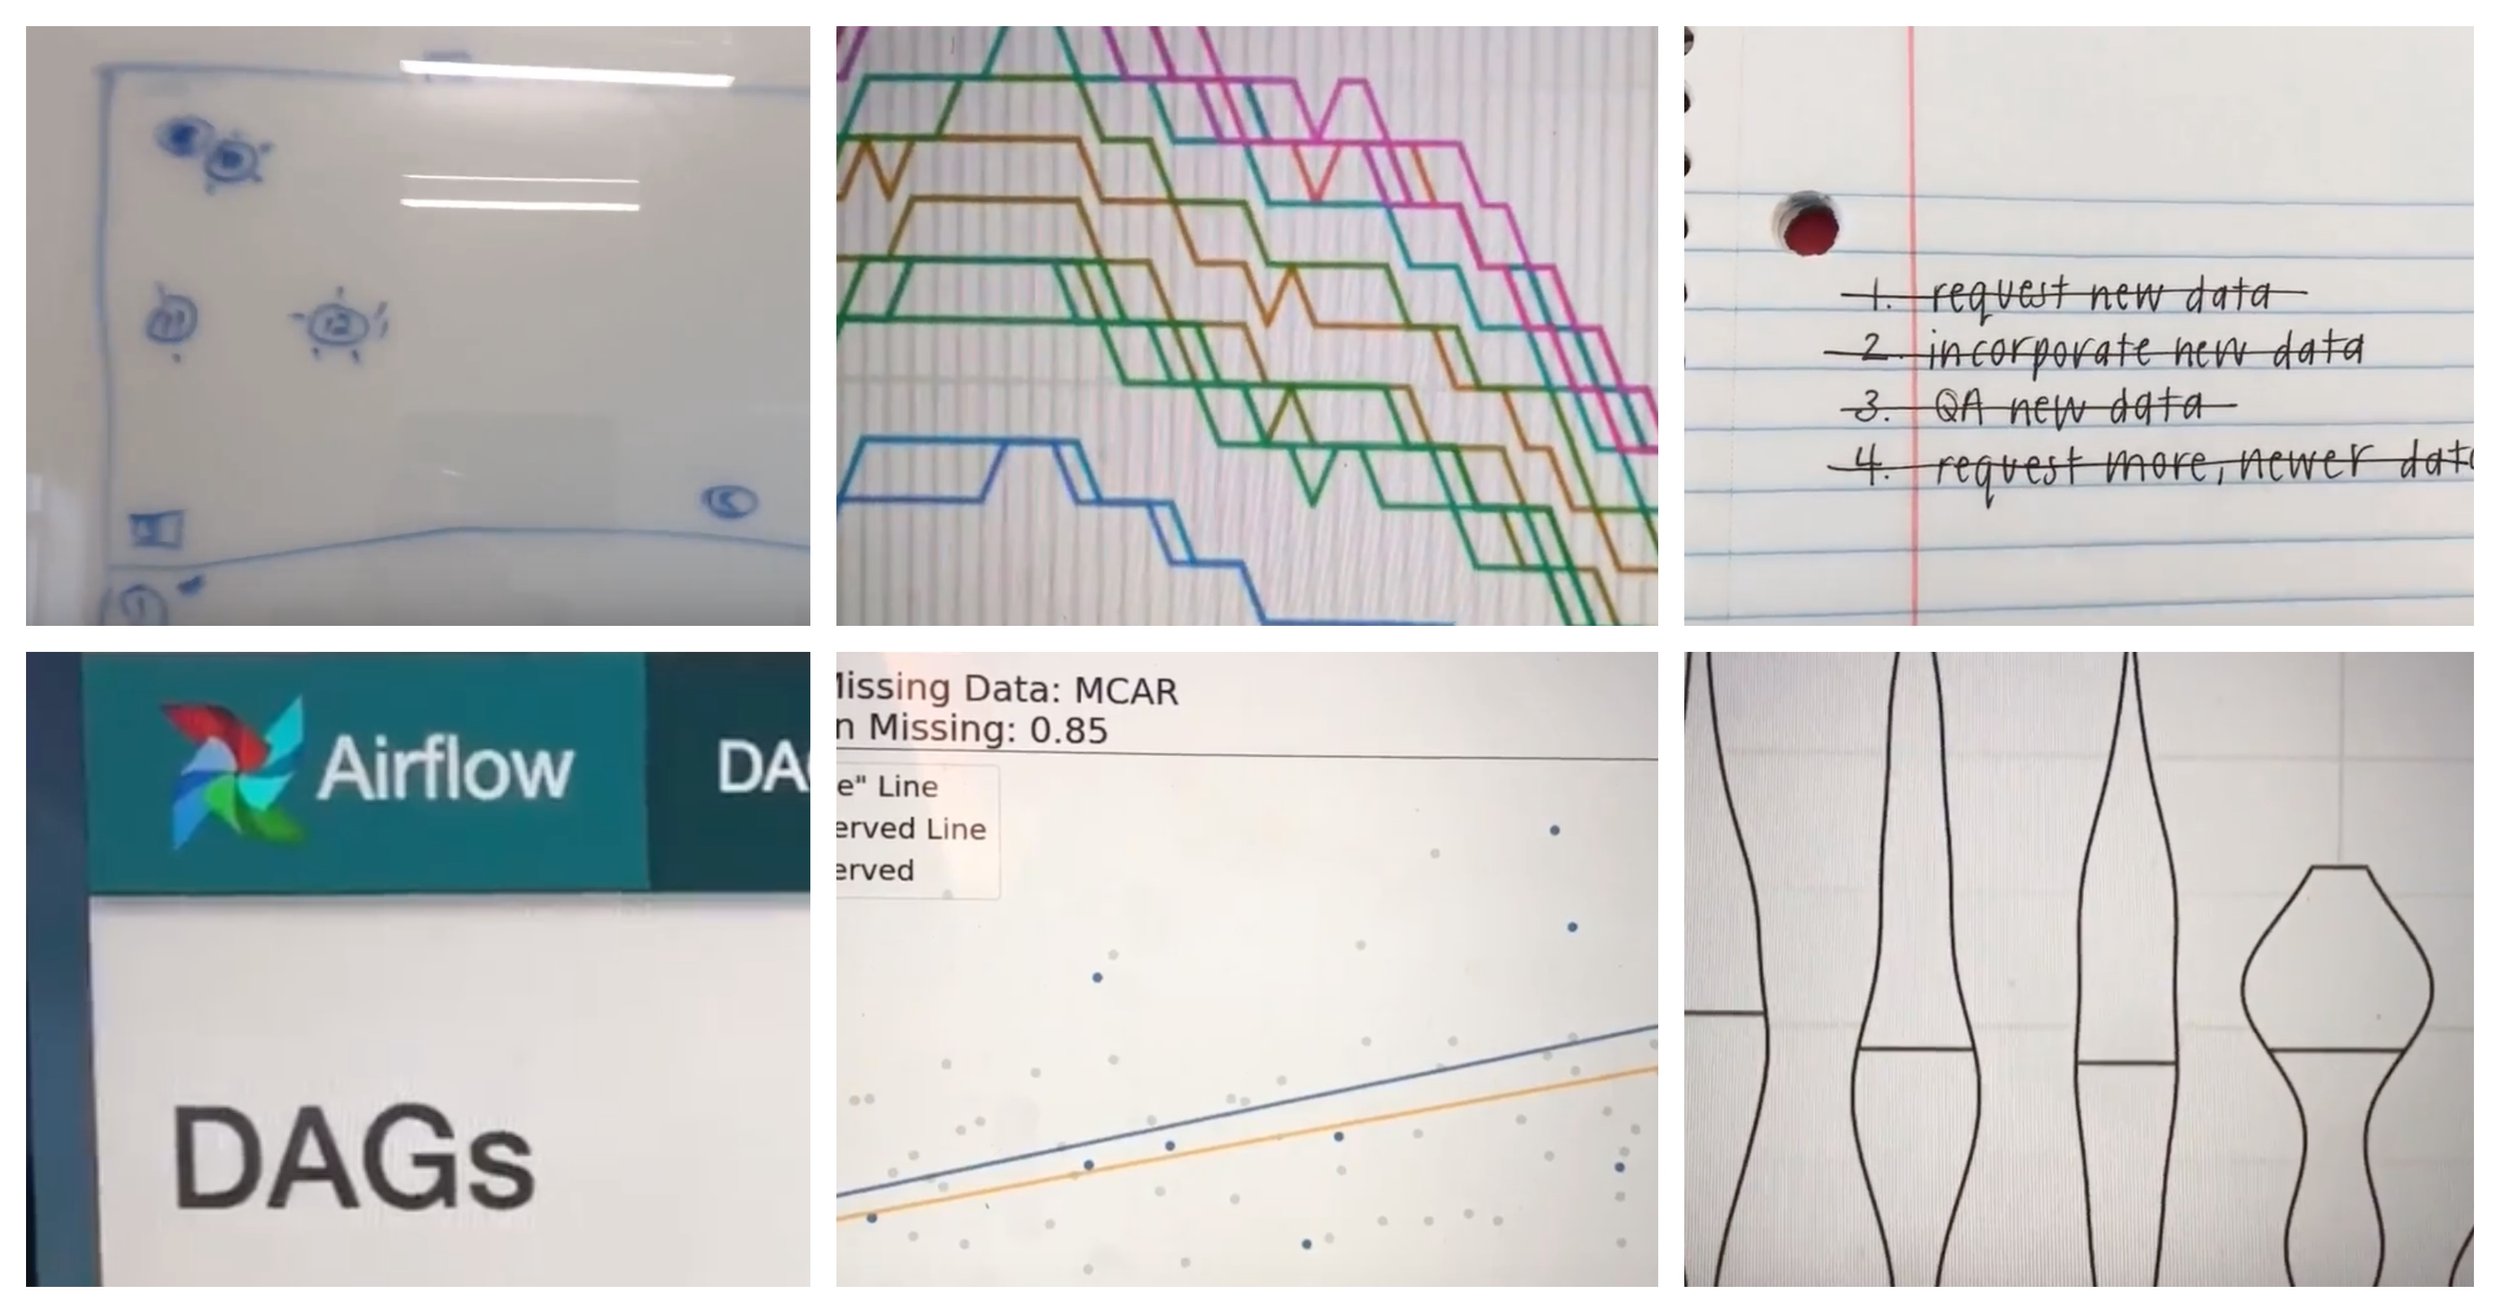
Working through my daily to-do list. This one includes incorporating and QA-ing a new set of data into our workflow.
Getting the word out about a panel that a few fellow data scientists and I are pitching for SXSW.
Visualizing test results with violin plots(!). A great way to combine and display data from a test on the distribution of signal strength.
Updating SQL case statements in our data ETL pipeline to account for a new case.
Writing pseudo-code documentation for a classifier so that others can understand the data that goes into it, the logic behind it, and are able to explain it in more simple terms to customers.
A quick shot of a “lab” we use to test equipment before it goes in the field. This was a test-heavy month.
This is the face I make approximately a dozen times per day when I'm questioning something I see in the data. I’m getting wrinkles from making this face.
This was a SQL-heavy month, since we were spending lots of time QA-ing our data.
Using Jupyter to spin up some quick exploratory data visualizations to present to answer a question my team had.
Playing with a cool way to visualize the impact of missing data at JupyterCon.
Dinner with R-Ladies NYC! I've had a lot of fun meeting R-Ladies when visiting various cities, and this was no exception -- it's nice to have a built-in group of people to hang out with in cities all around the world.
Swag from the Netflix booth at JupyterCon -- read about all of the cool things they're doing in my Jupytercon recap.
Building and visualizing an ad-hoc analysis request from a client.
After making some changes to our data pipeline, monitoring the DAGs in Apache Airflow to make sure everything updates smoothly.
More data visualization while bug-hunting to spot the source of an error in our data pipeline.