
Git Your SQL Together (with a Query Library)
Focusing on these points has led to my continuous adoption of a query library -- a git repository for saving and sharing commonly (and uncommonly) used queries, all while tracking any changes made to these queries over time.

If I could teach SQL to analysts who plan to work in industry data science, I'd start by sharing a few SQL Truths I've learned, and why I recommend tracking SQL queries in git. Here goes:
You will *always* need that query again
Queries are living artifacts that change over time
If it’s useful to you, it’s useful to others (and vice versa)
Focusing on these points has led to my continuous adoption of a query library -- a git repository for saving and sharing commonly (and uncommonly) used queries, all while tracking any changes made to these queries over time.
Anyone who is following my personal journey might know that I'm in the midst of building data science infrastructure at a start-up. In addition to setting up a data dictionary, setting up a query library is one of the first things I did to start documenting the institutional knowledge we have about our data.
Let’s talk more about these SQL Truths and why they've led me to git my SQL together with query libraries (and how to build one yourself!).
SQL Truth #1: You will always need that query again.
Have you ever written a query for a “one-off” analysis, deleted it (maybe even on purpose! *shudders*), and lost all memory of how to create said query -- just before being asked to re-run or tweak that analysis? Happens to the best of us.
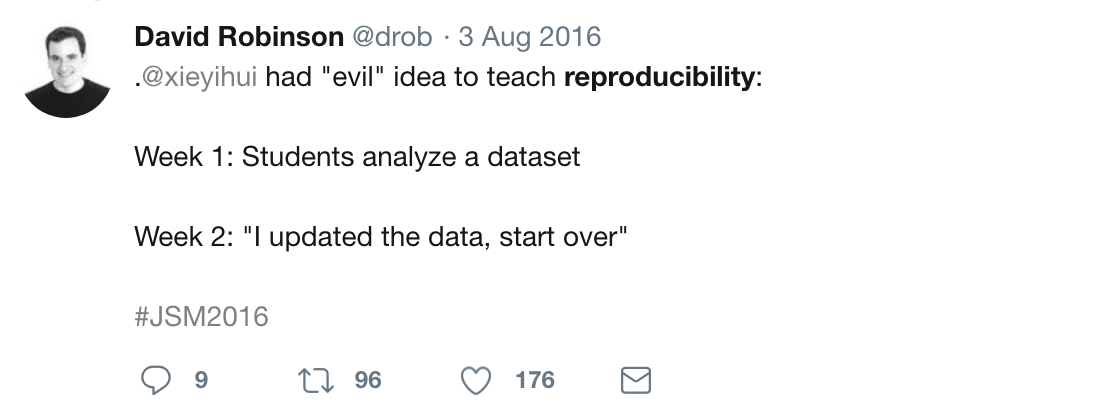
Usually, this is a job for reproducibility. But, even if we take reproducibility seriously (and we do!), it’s easy for queries from “one-off” analyses to slip through the cracks because they can live outside of our normal project workflow. After all, if you’re only doing something once, there’s no need for it to be reproducible, right?
The sooner we can accept that it’s never just once, the sooner we can hit CTRL+S, put them in a query library, and move on to more interesting problems.
SQL Truth #2: Queries are living artifacts that change over time
Here’s a short list of reasons why your queries might change over time:
You’ve become more familiar with database(s)
You’ve gained a deeper understanding of your data
You’ve had to add filters and caveats over time
You’ve changed the way you calculate a metric
You’re answering slightly different questions
You’ve started collecting new data
You’ve found discrepancies or issues with tables or fields
Your business model has changed
You’ve gotten better at writing SQL
This list isn’t all-inclusive, but hopefully it gives you an idea of how and why your queries might change. This isn’t inherently good or bad; it just means that you’ll want to capture the way that you’re doing things both as documentation for the future and to ensure that changes or updates are applied as needed to keep things up-to-date.
SQL Truth #3: If it’s useful to you, it’s useful to others
Have you ever asked a coworker where some data lives and had them respond with a beautiful, hand-curated SQL query? It’s the best. You get to focus more on the fun analysis, or starting new projects, and as a bonus, your company isn’t paying two people to repeat the same process.
SQL queries contain built up domain knowledge -- the way you filter, join, and aggregate tables reflects knowledge you’ve collected about how the data is collected, stored, and should be used for practical application. Sharing queries with others is a nice thing to do, and a good way to spread institutional knowledge about your data (as is building a good data dictionary!).
When you start to compile and compare SQL queries, you might find discrepancies in the way that different people pull the same data. (This happened on a team I was on -- if you asked three of us to pull all live clients, we’d all do it with slightly different caveats that reflected our individual understanding of the data. Not a bad thing, but no wonder our numbers didn’t always match!) Creating and reviewing a query library is also good way to get everyone on the same page.
Building your own query library
Let's focus on how you can build your own query library in a few simple steps:
After writing a query that you’ll want to use again*, save it(!!) as a .sql file with a descriptive name. I tend to name my files based on what the query is accomplishing as output, and since naming things is cheap (and I never have to hand-type the names of these files), I use very descriptive (long) names, like activity_on_mobile_since_june2018_by_client.sql.
*This was a test -- every query is a query you might want to use again!Create a git repository in a shared location and upload your queries to it. Encourage your team to do the same, and discuss how to best organize queries with them. This is also a good time for a mini blameless post-mortem of existing queries (especially if they come from different analysts) by looking for discrepancies and using them as an opportunity to level-up everyone's understanding of the data.
Whenever you create a new query, take a few minutes to clean it up so that others can understand how and when they might want to use it, and upload it to the query repository. Whenever you update an existing query locally, make sure to commit those changes to your query library (ideally along with an explanation of why you made them).
Final Notes
The idea of the query library was introduced to me by Tim, who implemented one for our product analytics team while we were both at Web.com. (You might remember Tim from this post on the career "tour of duty" concept.) It was helpful for our team there, and I've happily implemented one on every team since.
I hope this post is helpful, and I'd love to hear from you if you have a data infrastructure tool or idea to share (or a question!); please write a comment below or ping me on Twitter. Thanks for reading!

Field Notes: Building Data Dictionaries

The scariest ghost stories I know take place when the history of data -- how it’s collected, how it’s used, and what it’s meant to represent -- becomes an oral history, passed down as campfire stories from one generation of analysts to another like a spooky game of telephone.
These stories include eerie phrases like “I’m not sure where that comes from”, “I think that broke a few years ago and I’m not sure if it was fixed”, and the ever-ominous “the guy who did that left”. When hearing these stories, one can imagine that a written history of the data has never existed -- or if it has, it’s overgrown with ivy and tech-debt in an isolated statuary, never to be used again.
The best defense I’ve found against relying on an oral history is creating a written one.
Enter the data dictionary.
A data dictionary is a “centralized repository of information about data such as meaning, relationships to other data, origin, usage, and format", and provides us with a framework to store and share all of the institutional knowledge we have about our data.
As part of my role as a lead data scientist at a start-up, building a data dictionary was one of the first tasks I took on (started during my first week on the job). Learning about our data is a crucial part of onboarding for data-focused roles, and documenting that journey in the form of a data dictionary provides a useful data asset for the company (which helps to preserve institutional knowledge) and simultaneously provides a good resource for analyzing the data. My data dictionary is a Google Sheets workbook that looks something like this:

I use one sheet for each database, and the same fields throughout:
Table: the table name, exactly the way it appears in the database
Table Notes: general notes on the table, like the theme of the data in the table, how often it gets updated, and where it comes from
Field: the field name, exactly as it appears in the database
Definition: a user-friendly (often long-form) definition of the field
Example value: used to show what data in that field actually looks like
Field notes: general notes on the field, sometimes including values, caveats or notes of interest, and places (like tables) to find more information about that field
Yours doesn’t have to look like this, and I’ve seen data dictionaries with other fields and structures, but feel free to borrow mine if you’re looking for a format to start with and riff on -- it’s worked well for me so far.
Lessons Learned and Best Practices
I’ve built at least half a dozen data dictionaries for various companies, and through that experience, some personal best practices have shaken out:
1. Start small and iterate
A couple of times while building a data dictionary, I tried to document every piece of data I found while spelunking around my company’s database, which was very painful and not a great use of time. Don’t do this.
Focus on starting with the data that’s important and useful to you and documenting those fields or tables. Then, as you incorporate more data from other tables or databases, focus on documenting those incrementally. Avoid shaving the yak.
2. Answer your own frequently asked questions
Over time, I’ve found myself asking the same questions over and over again about data lineage and usage, so those are the questions I try to answer when building and filling in a data dictionary. Here’s a basic list of questions to consider:

3. Consider who will be using your data dictionary and how
The structure, content, and location of your data dictionary should be very different if your context is for analyst use in the trenches vs. for business stakeholder understanding. It could also look different depending on the people or groups who will be using it as a reference.
For example, my data dictionaries tend to contain notes pertaining to analyzing the data that others might not need -- things I might edit or remove if I were creating a shared cross-functional resource. I've also created versions of data dictionaries that are structured as documents rather than spreadsheets, a format that lends itself well to going very in-depth about fields (if you can't fit that info in a spreadsheet cell) or sharing with less-technical folks alongside a deliverable (like an analysis). These also make a great first draft to be turned into a more shareable version later.
4. Plan for a living document
For a data dictionary to be useful, it has to be kept up-to-date. This is a challenge that straddles both technical and cultural realms.
Technically, to keep a data dictionary up-to-date, it should to be straightforward for collaborators to access and update. It's also helpful to be able to see when these updates are made to track important changes. Culturally, the importance of a data dictionary should be acknowledged, and upkeep should be incentivized. It's easy to skip documentation if it's not required or seen as important, and this is how documentation grows stale (and eventually dies when deemed worthless).
I'll freely admit that I have yet to implement a data dictionary that perfectly addresses both of these challenges, but I'm working on it, and others have made good suggestions on the "how" below that I plan to incorporate in my own work.
Improvements + More Discussion
There are a few things about my own data dictionaries that could be improved. Namely, I plan to make my data dictionary more “internally public” (as something like a Github wiki or a Confluence page), and add it to source / version control (git) to track changes.
Some of my biggest concerns are making sure that others know about, have access to, and can use and update any data dictionaries I’m building. Some of this is cultural and some of this is technical, so I’m doing by best to tackle these concerns as I’m building, and asking others for advice along the way.
For more ideas and best practices around data dictionaries, check out these two Twitter threads which are full of great suggestions. If you’ve built a data dictionary and have some best practices to share, or if you have questions about how to get started, please feel free to chime in on Twitter or as a comment here.

Data Meta-Metrics
Not all of the data was equally relevant to the questions we ask of it, not all of the data is trustworthy, and not all analyses are neatly reproducible.
Sometimes I work with great data: I know how and when it's collected, it lives in a familiar database, and represents exactly what I expect it represent. Other times, I've had to work with less-than-stellar data -- the kind of data that comes with an "oral history" and lots of caveats and exceptions when it comes to using it in practice.
When stakeholders ask data questions, they don't know which type of data -- great, or less-than-stellar -- is available to answer them. When the data available falls into the latter camp, there is an additional responsibility on the analyst to use the data appropriately, and to communicate honestly. I can be very confident about the methodologies I'm using to analyze data, but if there are issues with the underlying dataset, I might not be so confident in the results of an analysis, or my ability to repeat the analysis. Ideally, we should be passing this information -- our confidences and our doubts -- on to stakeholders alongside any results or reports we share.
So, how do we communicate confidences and doubts about data to a non-technical audience (in a way that is efficient and easily interpretable)? Lately I've been experimenting with embedding a "state of the data" in presentations through red, yellow, and green data meta-metrics.
**
Recently my team wanted to know whether a new product feature was increasing sales. We thought of multiple ways to explore whether the new feature was having impact, including whether emails mentioning the new feature had higher engagement, and using trade show data to see whether there was more interest in the product after the feature was released. Before starting the analysis, we decided that we'd like this analysis to be repeatable -- that is, we'd like to be able to refresh the results as needed to see the long-term impact of the feature on product sales.
Sounds easy, right? Collect data, write some code, and build a reproducible analysis. I thought so too, until I started talking to various stakeholders in 5+ different teams about the data they had available.
I found the data we wanted in a variety of states -- anywhere from "lives in a familiar database and easy to explore" to "Anna* needs to download a report with very specific filters from a proprietary system and give you the data" to "Call Matt* and see if he remembers". Eventually I was able to get some good (and not-so-good) data together and build out the necessary analyses.
While compiling all of the data and accompanying analyses together for a presentation, I realized that I needed some way to communicate what I had found along the way: not all of the data was equally relevant to the questions we were asking of it, not all of the data was trustworthy, and not all of the analysis was neatly reproducible.
The data meta-metrics rating system below is what I've used to convey the quality of the data and its collection process to technical and non-technical members of my team. It's based on three components: relevance, trustworthiness, and repeatability. The slide below outlines the criteria I used for each score (green, yellow, red) in each category.

Within the presentation, I added these scores to the bottom of every slide. In the below example, the data we had definitely answered the question we were asking of it (it was relevant), and I trusted the source and data collection mechanism, but the analysis wasn't fully reproducible -- in this case, I needed to manually run a report and export a text file before being able to use it as an input in an automated analysis. Overall, this data is pretty good and I think the rating system reflects that. The improvement that would take this data to green-green-green would be pretty simple -- just writing the email data to a more easily accessible database, which becomes a roadmap item if we feel this report is valuable enough that we'll want to repeat it.

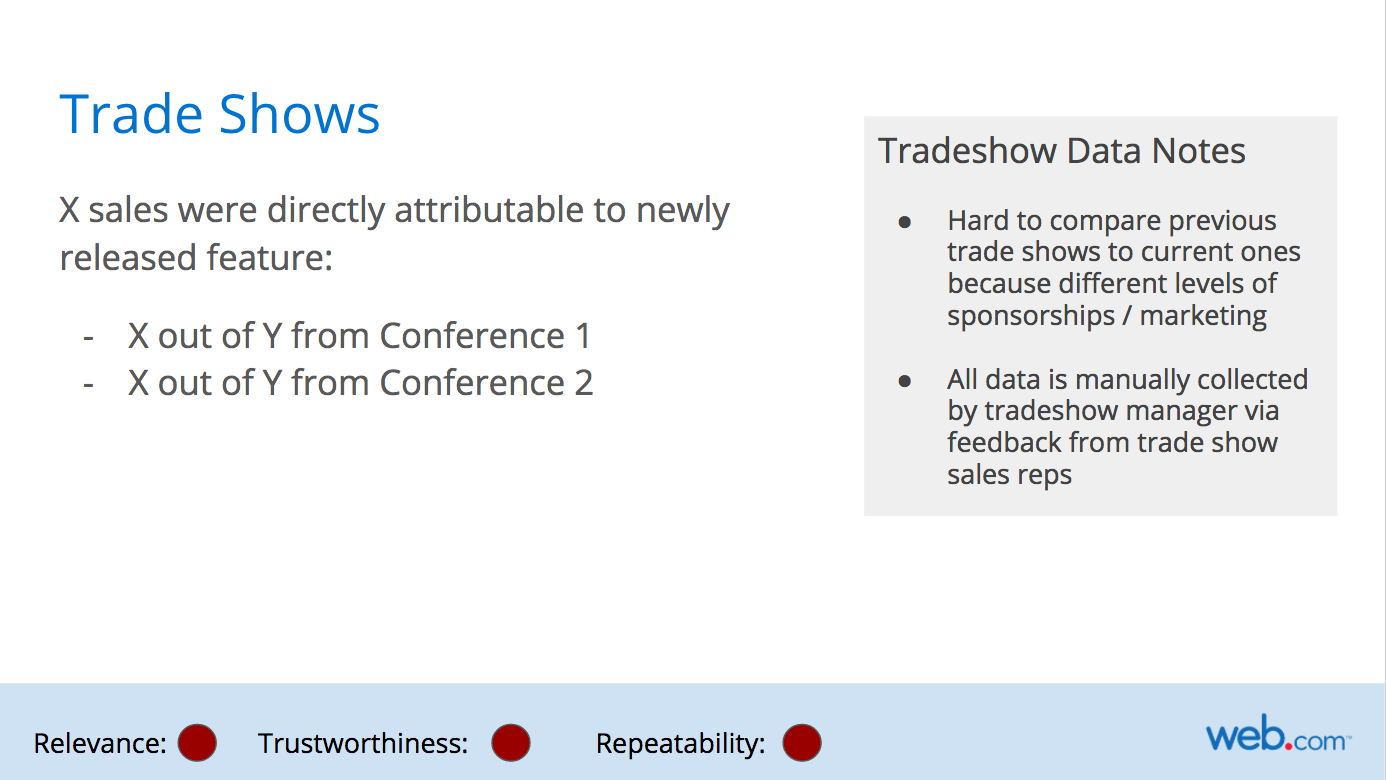
Below is an example of a not-so-great data process. Trade shows are inherently pretty chaotic, and our data reflects that. It's hard to tell what specifically makes a trade show attendee interested in a product, and tracking that journey in real-time is much harder without records of interactions like demos, phone calls, etc.. This becomes another road map item; if we want to dig deeper into trade show data and use it to guide product decisions, we need to implement better ways of collecting and storing that data.
Overall, this exercise was helpful for diagnosing the strengths and weaknesses of our data storage and collection across multiple teams. Providing this data in an easy-to-understand format allowed us to have informative conversations about the state of our data and what we could do to improve it. Getting the rest of the team involved in the data improvement process also helps my understanding of what data we do and don't have, what we can and can't collect, and makes my analyses more relevant to their needs.
The meta-metrics I used here are the ones we specifically cared about for this type of analysis; I could certainly see use cases where we might swap out or add another data meta-metric. If you've worked on conveying "the state of the data" or data meta-metrics to your team, I'd love to hear more about your process and the meta-metrics you've used in the comments.
* Names have been changed to protect the innocent.