
Field Notes: Building Data Dictionaries

The scariest ghost stories I know take place when the history of data -- how it’s collected, how it’s used, and what it’s meant to represent -- becomes an oral history, passed down as campfire stories from one generation of analysts to another like a spooky game of telephone.
These stories include eerie phrases like “I’m not sure where that comes from”, “I think that broke a few years ago and I’m not sure if it was fixed”, and the ever-ominous “the guy who did that left”. When hearing these stories, one can imagine that a written history of the data has never existed -- or if it has, it’s overgrown with ivy and tech-debt in an isolated statuary, never to be used again.
The best defense I’ve found against relying on an oral history is creating a written one.
Enter the data dictionary.
A data dictionary is a “centralized repository of information about data such as meaning, relationships to other data, origin, usage, and format", and provides us with a framework to store and share all of the institutional knowledge we have about our data.
As part of my role as a lead data scientist at a start-up, building a data dictionary was one of the first tasks I took on (started during my first week on the job). Learning about our data is a crucial part of onboarding for data-focused roles, and documenting that journey in the form of a data dictionary provides a useful data asset for the company (which helps to preserve institutional knowledge) and simultaneously provides a good resource for analyzing the data. My data dictionary is a Google Sheets workbook that looks something like this:

I use one sheet for each database, and the same fields throughout:
Table: the table name, exactly the way it appears in the database
Table Notes: general notes on the table, like the theme of the data in the table, how often it gets updated, and where it comes from
Field: the field name, exactly as it appears in the database
Definition: a user-friendly (often long-form) definition of the field
Example value: used to show what data in that field actually looks like
Field notes: general notes on the field, sometimes including values, caveats or notes of interest, and places (like tables) to find more information about that field
Yours doesn’t have to look like this, and I’ve seen data dictionaries with other fields and structures, but feel free to borrow mine if you’re looking for a format to start with and riff on -- it’s worked well for me so far.
Lessons Learned and Best Practices
I’ve built at least half a dozen data dictionaries for various companies, and through that experience, some personal best practices have shaken out:
1. Start small and iterate
A couple of times while building a data dictionary, I tried to document every piece of data I found while spelunking around my company’s database, which was very painful and not a great use of time. Don’t do this.
Focus on starting with the data that’s important and useful to you and documenting those fields or tables. Then, as you incorporate more data from other tables or databases, focus on documenting those incrementally. Avoid shaving the yak.
2. Answer your own frequently asked questions
Over time, I’ve found myself asking the same questions over and over again about data lineage and usage, so those are the questions I try to answer when building and filling in a data dictionary. Here’s a basic list of questions to consider:

3. Consider who will be using your data dictionary and how
The structure, content, and location of your data dictionary should be very different if your context is for analyst use in the trenches vs. for business stakeholder understanding. It could also look different depending on the people or groups who will be using it as a reference.
For example, my data dictionaries tend to contain notes pertaining to analyzing the data that others might not need -- things I might edit or remove if I were creating a shared cross-functional resource. I've also created versions of data dictionaries that are structured as documents rather than spreadsheets, a format that lends itself well to going very in-depth about fields (if you can't fit that info in a spreadsheet cell) or sharing with less-technical folks alongside a deliverable (like an analysis). These also make a great first draft to be turned into a more shareable version later.
4. Plan for a living document
For a data dictionary to be useful, it has to be kept up-to-date. This is a challenge that straddles both technical and cultural realms.
Technically, to keep a data dictionary up-to-date, it should to be straightforward for collaborators to access and update. It's also helpful to be able to see when these updates are made to track important changes. Culturally, the importance of a data dictionary should be acknowledged, and upkeep should be incentivized. It's easy to skip documentation if it's not required or seen as important, and this is how documentation grows stale (and eventually dies when deemed worthless).
I'll freely admit that I have yet to implement a data dictionary that perfectly addresses both of these challenges, but I'm working on it, and others have made good suggestions on the "how" below that I plan to incorporate in my own work.
Improvements + More Discussion
There are a few things about my own data dictionaries that could be improved. Namely, I plan to make my data dictionary more “internally public” (as something like a Github wiki or a Confluence page), and add it to source / version control (git) to track changes.
Some of my biggest concerns are making sure that others know about, have access to, and can use and update any data dictionaries I’m building. Some of this is cultural and some of this is technical, so I’m doing by best to tackle these concerns as I’m building, and asking others for advice along the way.
For more ideas and best practices around data dictionaries, check out these two Twitter threads which are full of great suggestions. If you’ve built a data dictionary and have some best practices to share, or if you have questions about how to get started, please feel free to chime in on Twitter or as a comment here.

A Month in the Life of a Data Scientist
I used the 1 Second Everyday app to take a series of one second videos of what my work as a data scientist at an IoT startup looked like during the month of August.
"What does a data scientist actually *do*?"
"What kinds of projects do you usually work on?"
"What does a typical day look like?"
These are questions I get asked a lot both by aspiring data scientists and the folks who want to hire them. My answer, in true data scientist fashion, is usually something along the lines of "it depends" -- and it's true! Most of my work involves juggling multiple projects that might have different stakeholders or touch different parts of the company, and the lifecycles of these projects can vary greatly depending on the complexity involved. In the eight years I've been doing applied analytics, no two weeks have looked the same. Furthermore, data science is such a growing and varied field that it's rare two data scientists would give the same answer (even at the same company!).
To help others get a feel for the types of projects a data scientist might do, and a bit of the day-to-day work, I used the 1 Second Everyday app to take a series of one second videos of what my work as a data scientist at an IoT startup looked like during the month of August. Check it out:
For context, my startup installed hardware into retail stores in order to track cardboard displays (the ones you see in CVS, for example, that are stocked with sunscreen or allergy medication) that go in and out of each store. We used sales data from those stores to calculate the incremental sales gained as a result of having these displays up, in addition to tracking other things like the supply chain process, and reported all of this back to the stores and brands whose products were on the displays. Lots of fun data to play with!
August consisted of three main projects for me (with lots of smaller projects thrown in):
Testing of IoT device updates: as an IoT company, we periodically rolled out firmware updates to our hardware, and August was a big update month. We used data to decide which units to update, how to space out the updates, and to monitor updates as they were being rolled out. After the updates, we performed more analysis to see whether the updates were making our RSSI signals stronger than they were before.
Improving our data pipeline: as a startup, we were constantly working to improve our data pipeline -- this meant incorporating new data, QA-ing our data inputs and pipeline outputs, chasing down bugs, updating to account for new logical cases and products, and building better documentation to describe what various pieces of the data pipeline were doing. As you can see, I used lots of data visualizations along the way to help us diagnose and improve the pipeline.
Professional development: I was fortunate enough to attend the JupyterCon tutorials and conference in August in NYC (check out my recap here). For me, conferences serve as a place to learn, meet great people, and get inspired by all of the cool things that folks are doing. Also, it's a lot of fun to do a local R-Ladies dinner, and I had a great time hanging out with NYC R-Ladies.
It's worth noting again that I had I taken these videos in July, or August, the set of projects I was working on would have been very different. (For example, one month was focused heavily on a classifier algorithm, and the other on creating and evaluating new metrics and ways of matching test and control stores.)
It's hard to distill the variance of a data scientist's job into a single video (or set of videos), but I hope this helps to give some insight into the types of projects a data scientist might be tasked with. One of the coolest things about being a data scientist right now is how much can vary day-to-day and week-to-week (even at the same job!) -- there's always more to learn and something new to try.
**
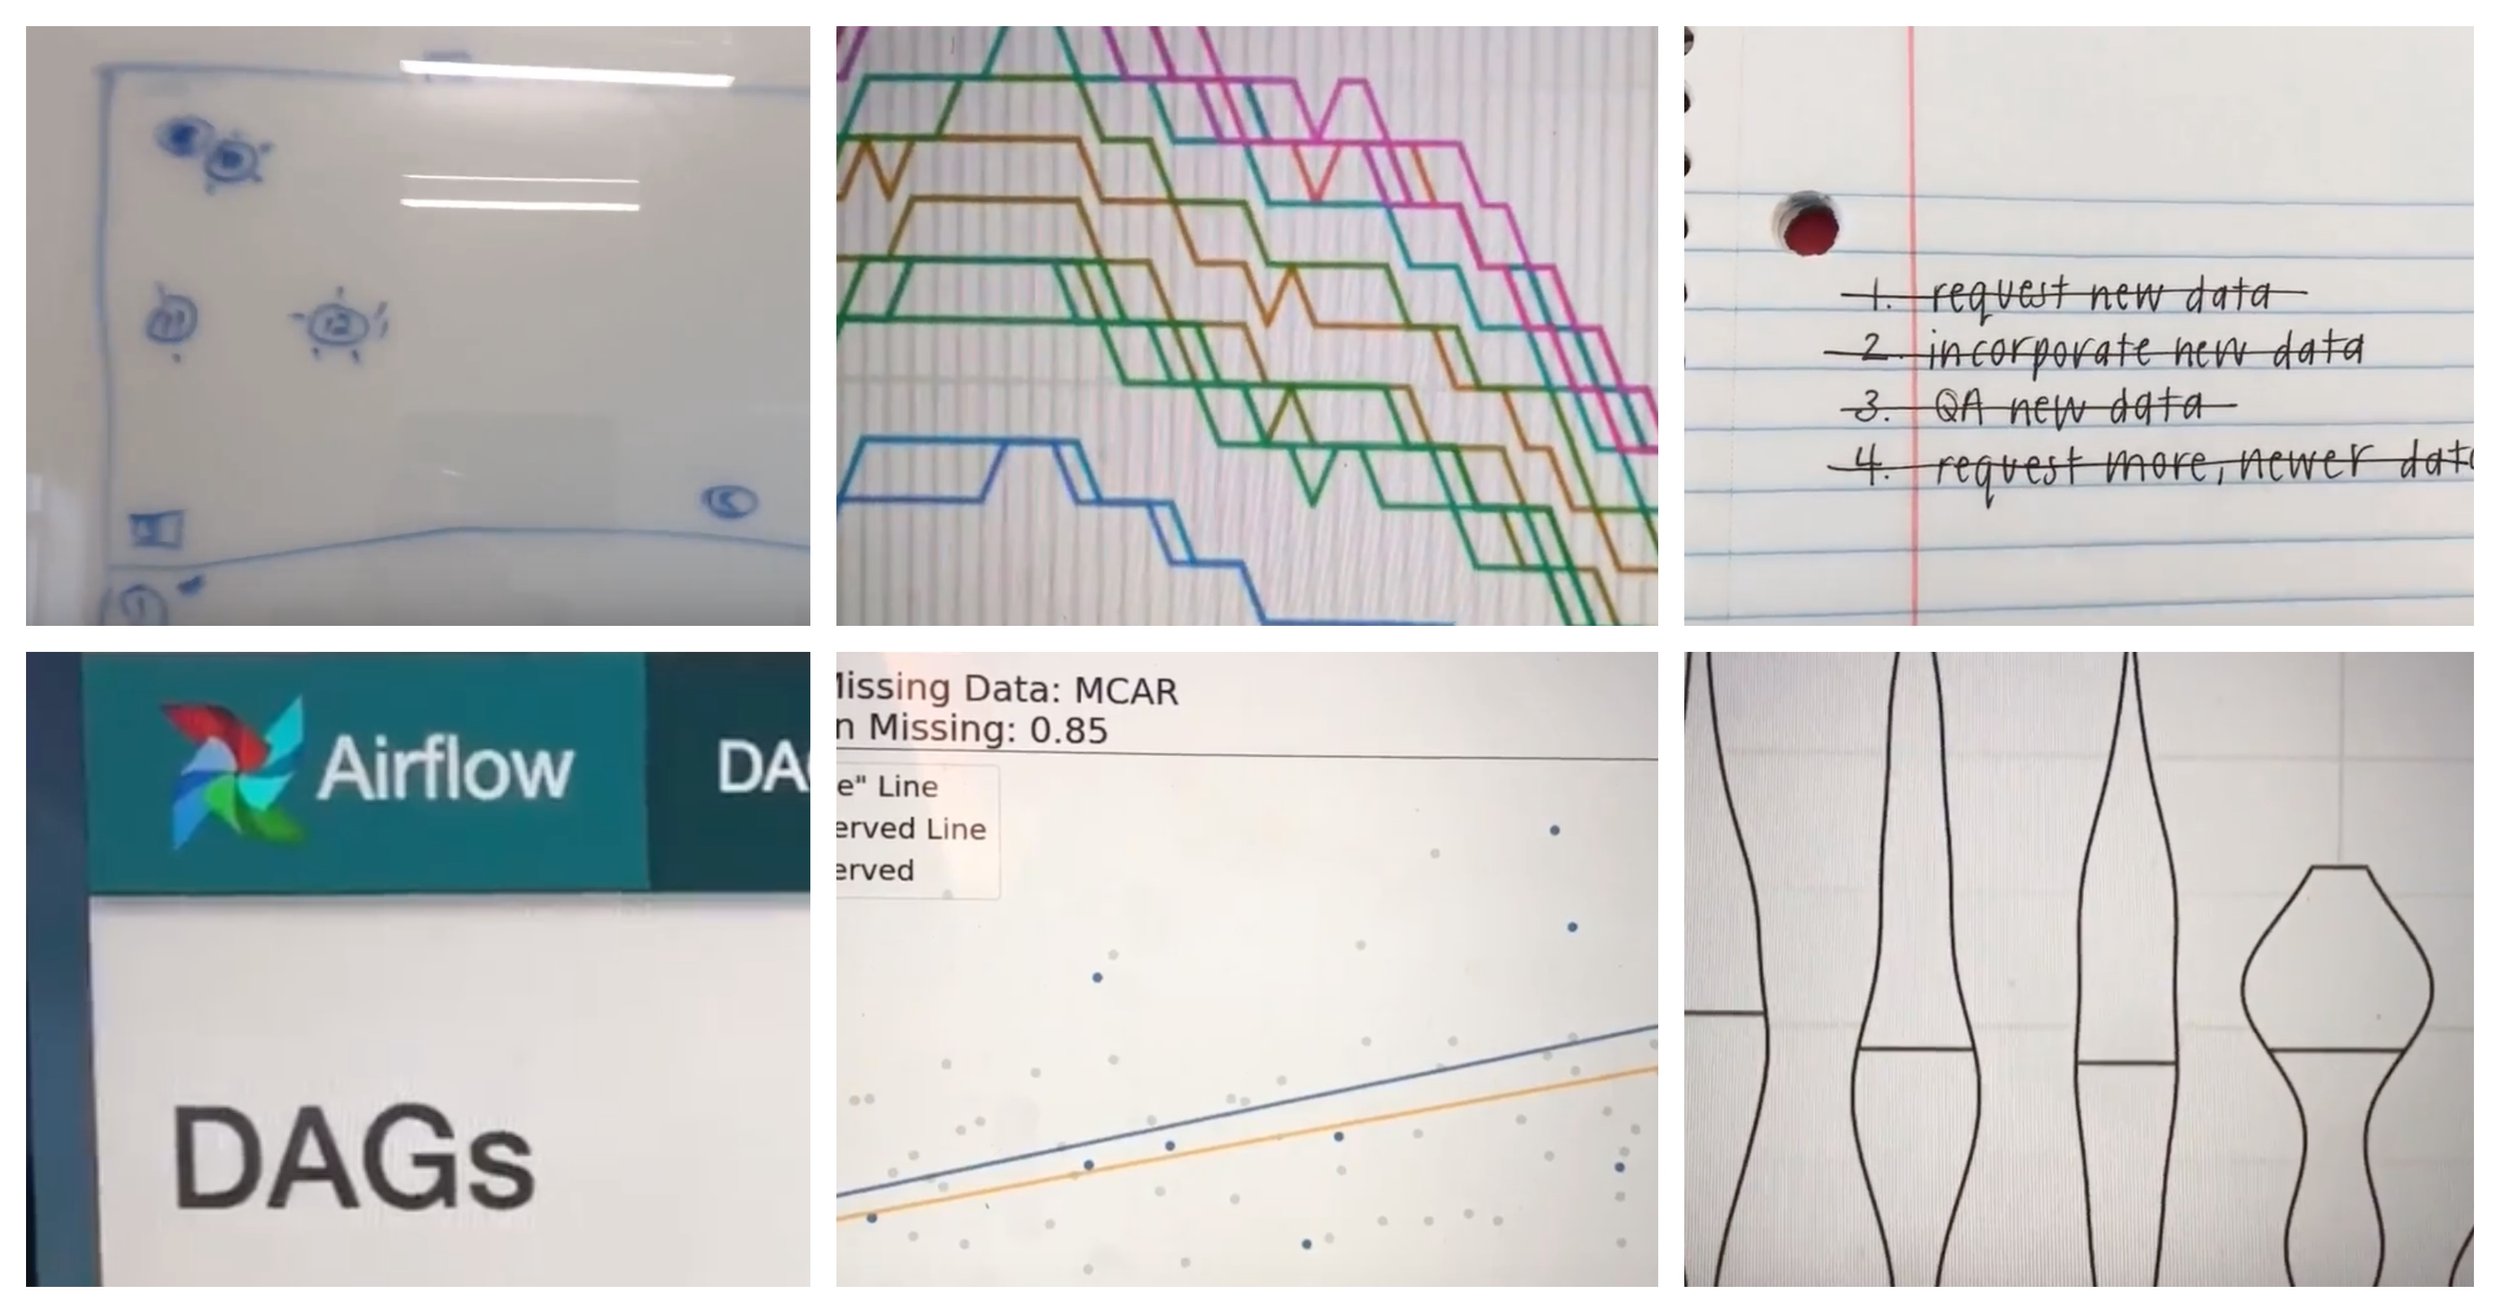
PS: Here's a full description of each snippet, in case you're curious:
Reviewing a design for a test of our hardware to be run in stores.
Working through my daily to-do list. This one includes incorporating and QA-ing a new set of data into our workflow.
Getting the word out about a panel that a few fellow data scientists and I are pitching for SXSW.
Visualizing test results with violin plots(!). A great way to combine and display data from a test on the distribution of signal strength.
Updating SQL case statements in our data ETL pipeline to account for a new case.
Writing pseudo-code documentation for a classifier so that others can understand the data that goes into it, the logic behind it, and are able to explain it in more simple terms to customers.
A quick shot of a “lab” we use to test equipment before it goes in the field. This was a test-heavy month.
This is the face I make approximately a dozen times per day when I'm questioning something I see in the data. I’m getting wrinkles from making this face.
This was a SQL-heavy month, since we were spending lots of time QA-ing our data.
Using Jupyter to spin up some quick exploratory data visualizations to present to answer a question my team had.
Playing with a cool way to visualize the impact of missing data at JupyterCon.
Dinner with R-Ladies NYC! I've had a lot of fun meeting R-Ladies when visiting various cities, and this was no exception -- it's nice to have a built-in group of people to hang out with in cities all around the world.
Swag from the Netflix booth at JupyterCon -- read about all of the cool things they're doing in my Jupytercon recap.
Building and visualizing an ad-hoc analysis request from a client.
After making some changes to our data pipeline, monitoring the DAGs in Apache Airflow to make sure everything updates smoothly.
More data visualization while bug-hunting to spot the source of an error in our data pipeline.

A Data Science Tour of Duty

In September 2015, I was looking for a job in Austin and started interviewing at Yodle, a marketing tech company. Yodle was looking for someone with experience in data and predictive analytics, and I was looking for a company where I could learn how to code and work on new, interesting problems. It was a good match, but one thing that made this opportunity stand out was the way that my soon-to-be boss described what my time there would be like -- a “tour of duty”. Tim was building a data science-y team and was testing out a management framework he had discovered called “The Alliance”. I was intrigued.
A tour of duty?
I’ll pause here for a quick explanation of The Alliance and the tour of duty concept.
The Alliance was created by LinkedIn cofounder Reid Hoffman to address a lack of trust and alignment between employers and employees in a networked age. The gist is that since pensions aren’t really a thing in tech and most people no longer spend a lifetime at the same company, employees behave more like free agents -- they are willing to leave a position when the next good thing comes along without concerns about loyalty to their employer.
The Alliance outlines a new employer-employee compact where employers can retain employees better by being open and honest about this situation and focusing on how they can add mutual value to each other. One way to do this is to establish a tour of duty for each employee -- a commitment by both parties to a specific and mutually beneficial mission (with explicit terms) to be accomplished over a realistic period of time. For a more thorough explanation, check out the visual summary below.
There are some other key components of The Alliance beyond the tour of duty that I’m not going to outline here. The framework for having open and honest conversations about career goals and timelines was also interesting and impactful for me, and worth a read if you’re interested.
My tour of duty
My transformational tour of duty started with making some goals to be incorporated into a formal growth plan. (One crucial piece of The Alliance is that the mutual agreement between employers and employees should be written down, which includes the things that each party hopes to achieve during the tour of duty.) My initial goals included learning to code, doing innovative data analysis, and learning to automate things, all of which would be put to use on a project to build in some automation around our A/B testing.
Building trust incrementally is another facet of The Alliance -- the relationship deepens as each side proves itself. I wanted to learn how to code, and Tim gave me about two months of paid development time to ramp up on company practices and learn to code before diving into analyses. This built trust for me immediately, and because my boss was willing to invest in me, I was happy to invest in his mission and doing great work for our team.
The timeline we set for this first tour was about two years, and especially at the end of my ramp-up period, I was feeling really good about it. We did weekly 1:1’s to check in, and I was able to freely talk about how my goals were changing as we accomplished things along the way.
...Okay, multiple tours of duty
Four months after I started, Yodle was acquired by Web.com. If you ever want to throw a wrench into long-term job plans, an acquisition really is a great way to go. Due to several shakeups that were beyond my boss’s control, I actually ended up completing three distinct tours of duty -- one in marketing analytics and automation, one in product analytics (including feature research and user behavior) and a final tour in production machine learning and data science.
During these times, Tim let me know when he was having doubts about projects or when tectonic shifts in our organization’s structure were coming. His openness and honesty empowered me to be open and honest. At one point, I told him that I didn’t want to do product analytics work -- my job at the time -- anymore. (Note: I actually like product analytics, but I really wanted to learn how to build machine learning models and put them into production.) My goals had grown with my skillset, and he added me to a team where I could pick up these new skills while continuing to add value to the business.
Multiple shorter tours was definitely was not what we initially planned, but we were able to be agile and adjust as needed, and I’m grateful to have gained valuable experience in multiple arenas. My last tour in particular was exactly the kind of transformational launchpad that we talked about when I first joined.
The end of the road
Tim had always been very up-front that if my dream job came along, I should take it. In turn, he let me know when he was contacted by dream-job-level prospects, and kept me up-to-date on how he was feeling about his role, his missions, and his career path. When I had an inkling of when it would be time for me to move on, I told him.
Another goal of The Alliance is to extend the relationship between employer and employee to be a lifetime relationship that exists beyond the scope of a single job. I feel really good about this. I’d love to work with Tim again because I know he cares about my career beyond a single job, and he demonstrated this by giving me the opportunity to work on projects that would grow my skillset and enable me to move on to the next thing.
Post-tour thoughts
If I had the chance to work within The Alliance framework again, I'd take it.
The Alliance is rewarding, but it's also tough. It takes commitment from both parties and a lot of gradual trust to get the point where you can talk openly about your career beyond the scope of a single job (but once you get there, it's worth it). When plans changed or gave way to new ones, being able to talk openly and honestly about what was and wasn't working allowed me to build my skills while helping the company with its goals -- a win-win.
My tour of duty was a transformative step in my career, exactly as it was designed to be. With a roadmap, a reasonable amount of time to dedicate, and a clear explanation of how my projects would be mutually beneficial to me and the company, I was enthusiastic about my work. I was given the opportunities I needed to learn new skills, build cool things, and work with great people. As my time at Web.com comes to an end, I'm happy, well-equipped, and ready to start my next tour of duty.
**
If you've worked under The Alliance framework, I'd love to hear about your experience and whether there's anything you might add or change -- feel free to ping me on Twitter.